Indices
Browse and select an item to view predictions
Loading...
AI-Powered Stock Predictions
Get real-time predictions using advanced machine learning models with ~78% directional accuracy. Search for any stock symbol to see detailed analysis and price forecasts.
Analyzing stock data and generating predictions...
Ready to analyze stocks
Enter a stock symbol above to get AI-powered predictions, technical analysis, and investment insights.
--
--
Last Price
--
Predicted Price
--
Expected Change
--
Model Accuracy
--
Price History & Prediction
Technical Analysis
Volatility
--
Volume
--
Valuation Metrics
P/E Ratio
--
P/B Ratio
--
P/S Ratio
--
Enterprise Value
--
Price/FCF
--
Market Cap
--
Profitability
Profit Margin
--
Gross Profit Margin
--
EBITDA Margin
--
Cash Flow Margin
--
ROE
--
ROA
--
ROCE
--
Financial Health
Debt/Equity
--
Debt/Assets
--
Debt/EBITDA
--
Liabilities/Equity
--
Interest Coverage
--
EBITDA/Interest
--
Debt Coverage
--
Growth Metrics
Revenue CAGR
--
YoY Growth
--
EPS Growth
--
Efficiency & Cash Flow
Asset Turnover
--
ROIC
--
FCF/Share
FCF/Interest
--
DIO
--
DSO
--
DPO
--
CCC
--
Per-Share Metrics
EPS
Book Value/Share
Sales/Share
FCF/Share
Dividend/Share
Dividend Yield
--
Payout Ratio
--
Valuation Assessment
Fair Value
--
Margin of Safety
--
Valuation Status
--
Final Score
--
Liquidity
Current Ratio
--
Quick Ratio
--
Cash Ratio
--
Cash/Liabilities
--
AI Investment Assistant
XGBoost Model Performance
Paper trading results from a brokerage account following our XGBoost stock prediction model. The model was activated in January 2026 — the improvement is clear.
Paper trading account for model validation purposes. Past performance does not guarantee future results.
No Systematic Model
Before XGBoost
Inception – Dec 31, 2025
+1.17%
vs Benchmark: approx. flat
- StrategyDiscretionary
- Sharpe RatioN/A
- Alpha~0%
Model Active
With XGBoost
Jan 1, 2026 – Present
+5.06%
vs Benchmark (S&P 500): +0.54%
+4.52% Outperformance — 9.4x Market
- Period~45 days
- Sharpe Ratio (YTD)5.6
- Sharpe Ratio (1M)16
- Alpha+4.52%
Validated
Model Validation
Proof Points
- YTD Return+5.06%
- YTD Benchmark+0.54%
- 1M Return+5.38%
- 1M Benchmark-0.54%
- 1M Outperformance+5.92%
- Sharpe Ratio (YTD)5.6
- Sharpe Ratio (1M)16
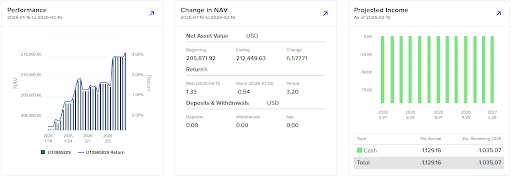
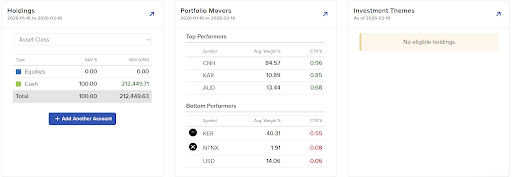
Year to Date (2026)
XGBoost Model ActivePerformance
Starting Balance$202,222.95
Ending Balance$212,452.70
Total Return ($)+$10,229.75
Total Return (%)+5.06%
Benchmark (S&P 500)+0.54%
Outperformance+4.52%
Holdings
Total Value$212,452.70
Equities 100%
Cash 0%
Bonds 0%
Equities$212,452.70
Cash$0.00
Bonds$0.00
Top Performers
KAR
+2.17%
CNH
+1.15%
AUD
+0.78%
Bottom Performers
KER
-0.55%
NTNX
-0.08%
USD
-0.06%
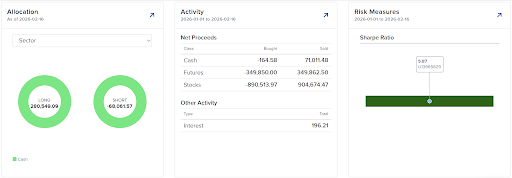
Activity
Equities Bought$349,860.39
Equities Sold$160,009.70
Net Equities+$189,850.69
Cash Bought$71,024.48
Cash Sold$71,189.04
Net Cash Proceeds+$164.56
Other Activity-$986.21
Interest$0.00
Risk Measures
Sharpe Ratio
5.6
Risk-Adjusted ReturnsExcellent
Benchmark CorrelationLow (outperforming)
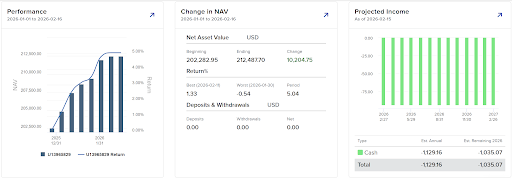

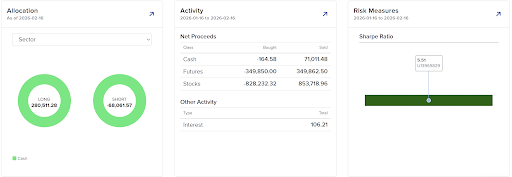
Last Month
XGBoost Model ActivePerformance
Starting Balance$201,617.92
Ending Balance$212,454.62
Total Return ($)+$10,836.70
Total Return (%)+5.38%
Benchmark (S&P 500)-0.54%
Outperformance+5.92%
Holdings
Total Value$212,454.62
Equities 100%
Cash 0%
Bonds 0%
Equities$212,454.62
Cash$0.00
Bonds$0.00
Top Performers
CNH
+0.96%
KAR
+0.85%
AUD
+0.68%
Bottom Performers
KER
-0.55%
NTNX
-0.08%
USD
-0.06%
Activity
Equities Bought$349,892.80
Equities Sold$160,042.76
Net Equities+$189,850.04
Cash Bought$71,074.49
Cash Sold$70,909.93
Net Cash Proceeds-$164.56
Other Activity-$986.21
Interest$0.00
Risk Measures
Sharpe Ratio
16
Benchmark Performance-0.54%
Model Performance+5.38%